3 Examples of Asymptotes
 written by Rida Mirza
An asymptote is a line that a curve approaches but never actually reaches or intersects.
Asymptotes are important features of graphs that provide useful information about the behavior of the functions in math, especially as x approaches positive or negative infinity.
In this article we will discuss Examples of Asymptotes.
Examples of Asymptotes
1: Horizontal Asymptotes
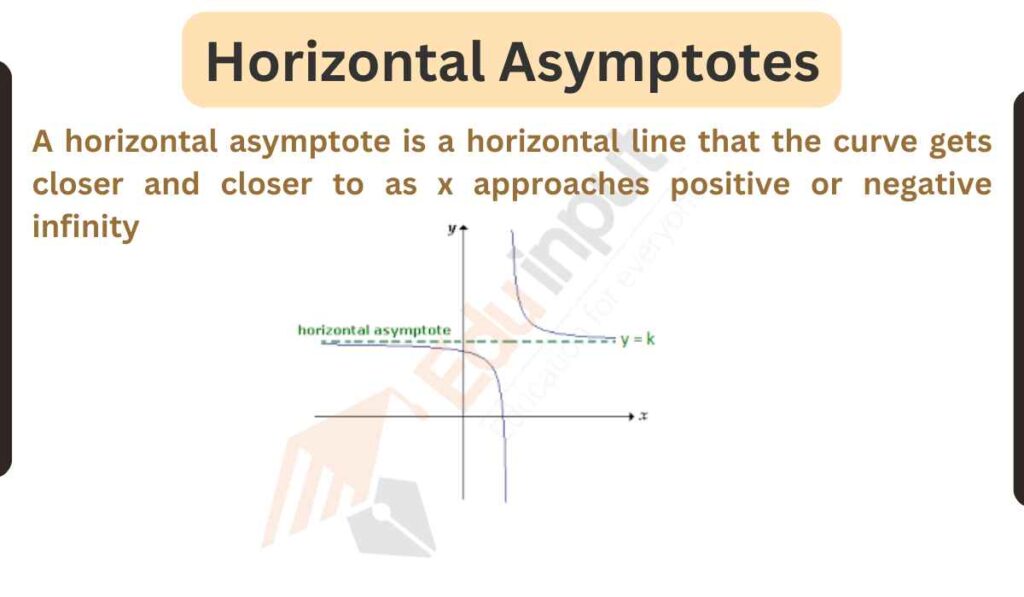
A horizontal asymptote is a horizontal line that the curve gets closer and closer to as x approaches positive or negative infinity.
The equation of a horizontal asymptote is usually in the form y = k, where k is a constant.
Example
The graph of the function f(x) = (x^2 + 3x + 2) / (x+2) has a horizontal asymptote at y = 1.
As x approaches positive or negative infinity, the function values get closer and closer to 1.
This is because as x gets very large, the x^2 term dominates the numerator while the x term dominates the denominator.
2: Vertical Asymptotes
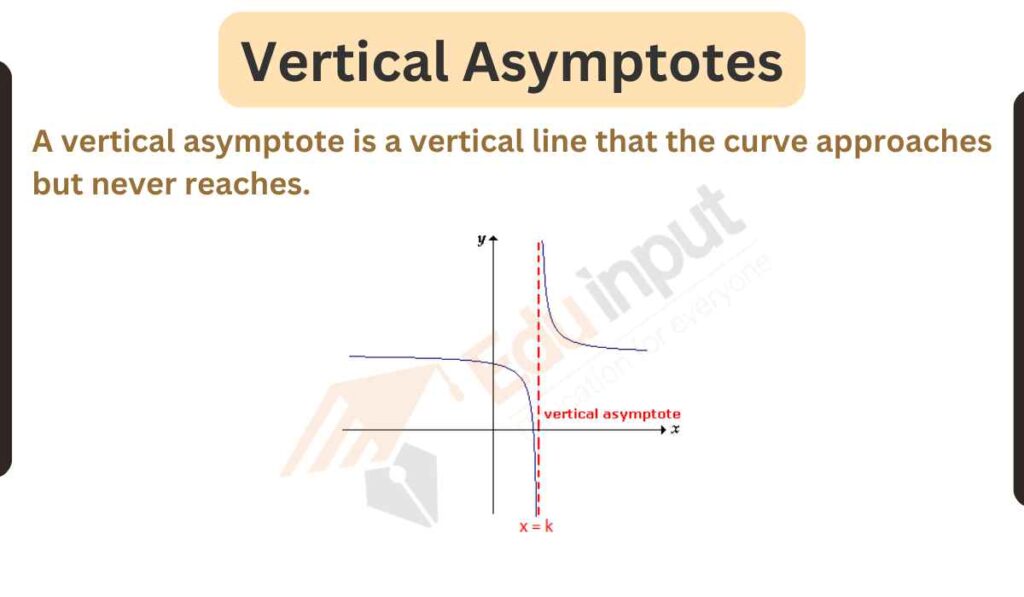
A vertical asymptote is a vertical line that the curve approaches but never reaches.
Vertical asymptotes occur when there is a discontinuity in the function at a certain x value, causing the function values to approach positive or negative infinity.
Vertical asymptotes indicate points where the function is undefined and has a discontinuity.
Example
The graph of f(x) = 1/(x-1) has a vertical asymptote at x = 1.
As x approaches 1 from either direction, the function values approach positive or negative infinity. The equation of the vertical asymptote is x = 1.
3: Oblique Asymptotes
An oblique asymptote is a slanted line that a curve approaches as x approaches positive or negative infinity.
Oblique asymptotes indicate the overall slanted direction of the curve.
Oblique asymptotes have equations in the form y = mx + b, where m and b are constants. The line shows the general trend of the curve as x approaches positive or negative infinity.
Example
the graph of f(x) = x/2 + 3 has an oblique asymptote with equation y = x/2.
As x gets very large positive or negative, the line y = x/2 is a close approximation of the function. The x/2 term dominates as x approaches infinity.
Asymptotes are like secret guides for understanding how graphs behave, especially when we are dealing with really big or really small numbers.


Leave a Reply