Graphing Linear Equations of Two Variables
 written by Rida Mirza
Graphing linear equations with two variables is an important skill in algebra. It allows us to visualize relationships between two quantities and is a fundamental tool in understanding real-world scenarios.
To simplify solving such equations, use our Two Step Equations Calculator for step-by-step solutions.
In this article, we will discuss the graphing linear equations with two variables.
Graphing Linear Equations with Two Variables
Step 1: Identifying the Equation
A linear equation with two variables typically follows the form:
y = mx + b
Here, (m) represents the slope, and (b) is the y-intercept.
Step 2: Plotting the Y-Intercept
Y-intercept (b) is the point where the line crosses the y-axis. To plot it, find the value of (b) and mark that point on the graph.
Step 3: Calculating the Slope
Slope (m) defines the line’s steepness. To find the slope, choose two points on the line and use the formula:
m= y2 – y1 / x2 – x1
Step 4: Plotting the Line
Starting from the y-intercept, use the calculated slope to find additional points on the line.
Solved Examples
Example
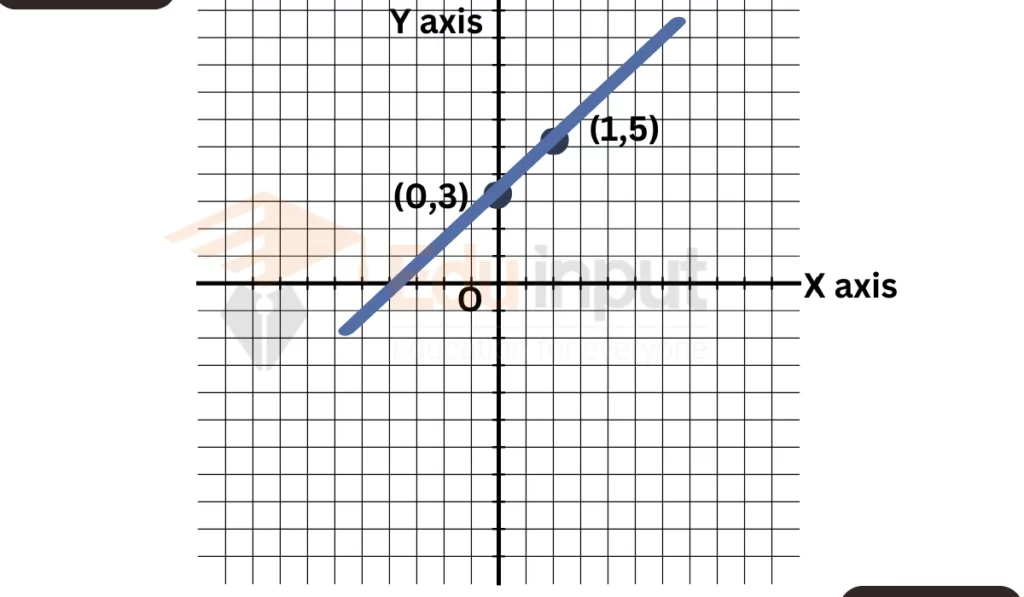
Graph the equation (y = 2x + 3).
Y-Intercept
Put x = 0 in equation,
y = 2(0) + 3
y = 3
So, the first point is (0, 3).
Slope
compare with general equation,
m = 2
Using the slope, we can find another point.
For example, let (x = 1). Then, y = 2(1) + 3 = 5. So, the second point is (1, 5).
Plot the two points on the graph and draw a straight line connecting them.
Example
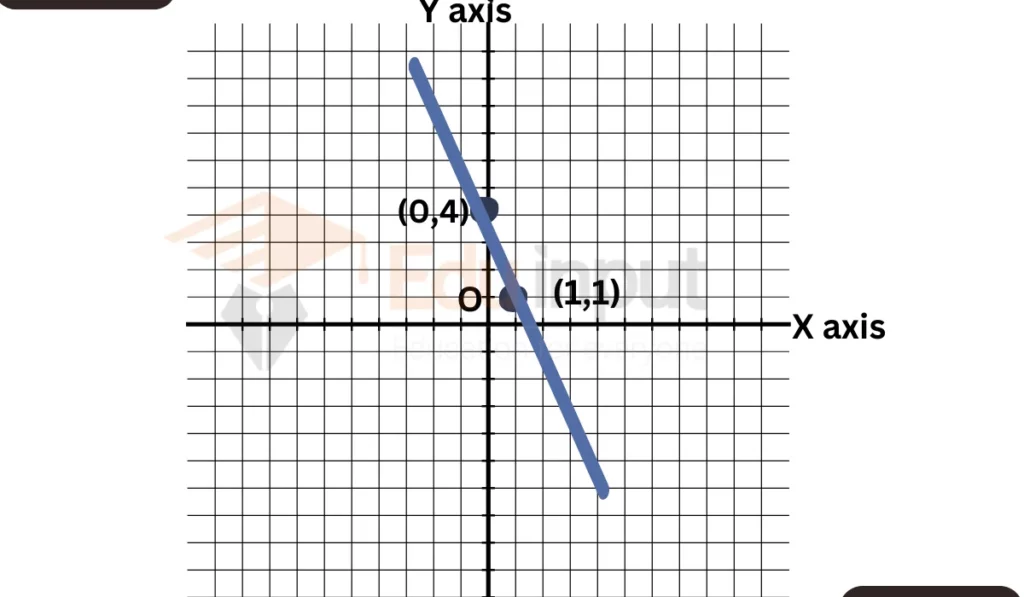
Graph the equation (y = -3x + 4).
Y-Intercept
For Y- intercept, put x=0
y = – 3(0) + 4
y = 4
So, the first point is (0, 4).
Slope
Compare with general equation,
m = -3
Using the slope, we can find another point.
Let (x = 1). Then, (y = -3(1) + 4 = 1). So, the second point is (1, 1).
Plot the points and draw the line.
FAQs
What is the significance of graphing linear equations with two variables?
Graphing allows us to visualize the relationship between two quantities, making it easier to analyze and solve real-world problems.
Can we have a negative slope in a linear equation?
Yes, a negative slope indicates a descending line, while a positive slope represents an ascending line.
Is it possible to graph equations with fractions?
Absolutely. You can graph equations with fractional slopes and intercepts just like whole numbers.
What if a linear equation has no y-intercept?
In such cases, the line will be parallel to the x-axis and will not intersect the y-axis.

Leave a Reply