10 Examples of Graphs
In mathematics, graphs are very important. One way they converge is through the use of graphs, which help us visualize and understand complex relationships.
In this article, we will explore ten examples of graphs in mathematics .

Examples of Graphs
These are 10 examples of graphs.
1: Graphs
Graphs in mathematics provide a visual representation of data or functions. They are essential tools for analyzing and solving real-world problems.
2: Linear Graph
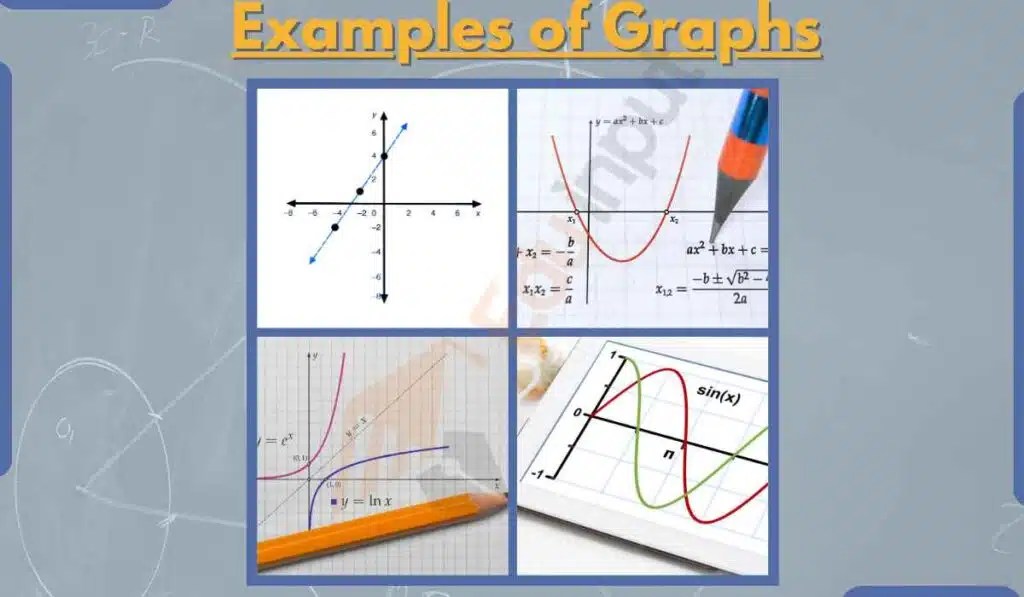
Linear graphs produce straight lines and are used to represent relationships with constant slopes, such as speed versus time for a moving object.
3: Quadratic Graph
Quadratic graphs form parabolic shapes and are commonly seen in physics to describe projectile motion or the path of a thrown object.
4: Exponential Graph
Exponential graphs display rapid growth or decay, often seen in processes like population growth, radioactive decay, or compound interest.
5: Sine and Cosine Graphs
Sine and cosine graphs create periodic waves, representing phenomena like sound waves, pendulum motion, and alternating currents in electronics.
6: Logarithmic Graph
Logarithmic graphs are the inverses of exponential functions and have applications in fields like chemistry (pH scale) and earthquake magnitude (Richter scale).
7: Circle Graph
Circle graphs, formed by trigonometric functions like sine and cosine, represent circular or oscillatory motions in physics and engineering.
8: Elliptical Graph
Elliptical graphs are a type of conic section and describe shapes like orbits of planets, paths of celestial objects, or lens designs in optics.
9: Parametric Equations
Parametric equations describe the path of a projectile, allowing us to predict where an object will land when launched at a certain angle and velocity.
10: Polar Graphs
Polar graphs are used to represent equations in polar coordinates, revealing symmetry and creating intricate shapes like spirals and cardioids


Leave a Reply