Frequency Distribution | Construction of Frequency table
A frequency distribution is a tabula arrangement for classifying data into different groups and the number of observations falling in each group corresponds to the respective group. The data presented in the form of frequency distribution is called grouped data.
Hence a frequency distribution is a method to summarize data.
Construction of frequency table:-
On the basis of types of variable or data, there are two types of frequency distribution .these are
- Discrete frequency distribution
- Continuous frequency distribution
Discrete frequency distribution
The following steps are involved in making a discrete frequency distribution.
- Find the minimum and maximum observation in the data and write the values of the variable in the variable column from minimum to maximum.
- Record the observations by using tally marks. (vertical bar’|’)
- Count the tally and write down the frequency in the frequency column
For example:-
Five coins are tossed 20 times and the number of heads recorded at each toss is given below:
3,4,2,3,3,5,2,2,2,1,1,2,1,4,2,2,3,3,4,2.
Make frequency distribution of the number of heads observed.
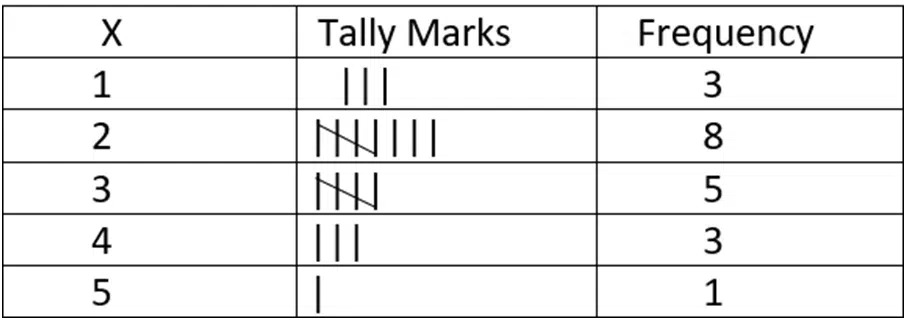
Solution: let X= number of heads. The frequency distribution is given below:
Minimum values in the given data=1
Maximum values in the given data=5
Frequency distribution of the number of heads

Continuous frequency Table
The making of continuous frequency distribution involves the following steps:
- Find the range
What is the range?
The difference between maximum and minimum observations
Formula:
Range =Xmax-Xmin
- Decide about the number of groups (denote it by K) into which the data is to be classified (usually integer between 5 and 20).usually it depends upon the range. The larger the range the more the number of groups.
- Determine the size of the class (denoted by h) by using the formula.
H=range/k
Use formula when (h)is not given
The rule of approximation is relaxed in determining h,
For example=7.1 or h=7.9 may be taken as 8.
- Start writing the classes or groups of the frequency distribution usually starting from the minimum observation and keeping in view the size of a class.
- Record the observations from the data by using tally marks.
- Count the number of tally marks and record them in the frequency from each class.
For example:
The following are the marks obtained by 40 students in mathematics of class X.
Make a frequency distribution with a class interval of size 10.
51,55,32,41,22,30,35,53,30,60,59,15,7,18,40,49,40,
25,14,18,19,2,43,22,39,26,34,19,10,17,47,38,13,30,
34, 54, 10, 21 51, 52.
Solution:
From the above data, we have Xmin=2 and Xmax=60. It is given that h=10 we can either start from 2 or the nearest smallest integer 0 for our convenience. There are two ways to make the distribution.
- We may write the actual observations of falling groups. This is given as follows.
| Classes/Group | observation | Frequency |
| 0–9 | 2,7 | 2 |
| 10–19 | 10,10,13,14,15,17,18, 18,19,19 | 10 |
| 20–29 | 21,22,22,25,26, | 5 |
| 30–39 | 30,30,30,32,34,34,35,38,39 | 9 |
| 40–49 | 40,40,41,43,47,49 | 6 |
| 50–59 | 51,51,52,53,54,55,59 | 7 |
| 60–69 | 60 | 1 |
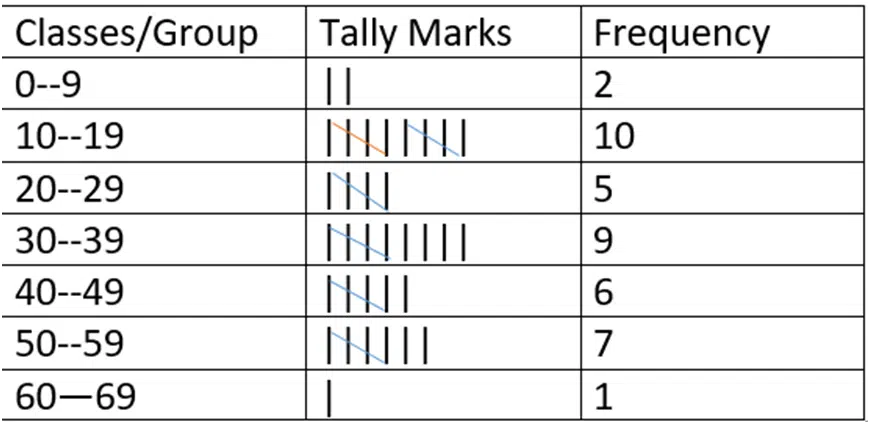
- Use tally marks for recording observation in the respective group. This is given in the following table

Solution (b) is usually adopted to construct a frequency distribution.
Frequently Asked Question-FAQs
What is a Frequency Distribution in Math?
Frequency distribution is a way of representing data that shows how often each observation occurs. This can be done in a tabular or graphical form.
What are the 2 Types of Frequency Distribution tables?
There are 2 types of frequency distributions:
Ungrouped frequency distribution
Grouped frequency distribution
What is Grouped Frequency Distribution?
A grouped frequency distribution shows the scores of a data set by grouping the observations into intervals and organizing these intervals into a frequency distribution table. The intervals in grouped frequency distribution are called class limits.
What are the Components of Frequency Distribution?
The components of the frequency distribution are as follows:
Class interval
Types of class interval
Class boundaries
Midpoint or classmark
Width or size of class interval
Class Frequency
Frequency class width


Leave a Reply