90+ Examples of Standard Deviation in Science, Finance, Education, Industry, and Everyday Life
 written by Sidra Batool
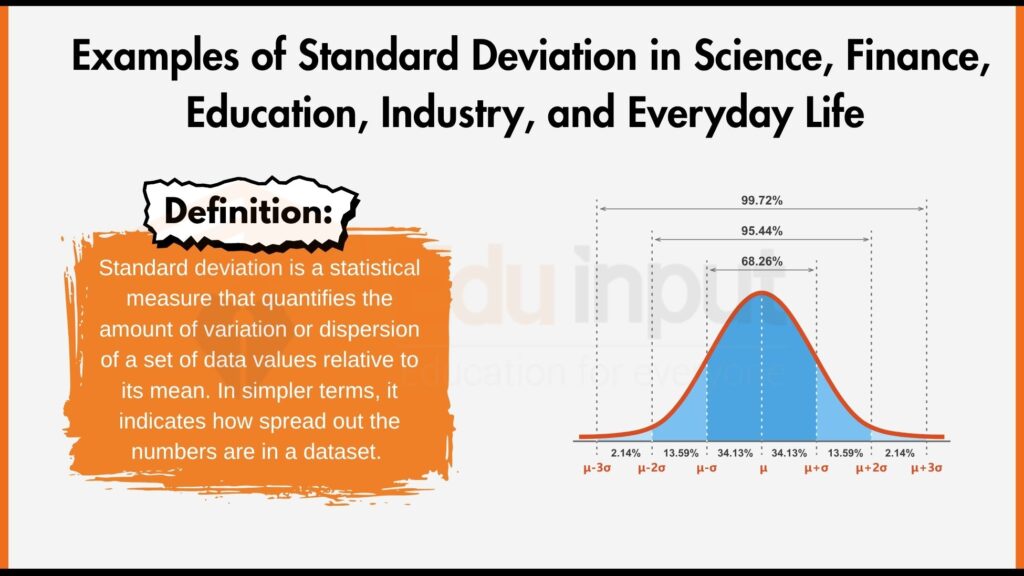
Scientific Research
1. Physics Experiments: Pendulum Times & Particle Speeds
In physics labs, students time a pendulum swing multiple times. Researchers measure particle velocities or currents through circuits repeatedly. Each set of measurements has a typical value and a spread. Standard deviation shows how much the times or speeds vary. It tells students if their timing method was precise or noisy. It’s also used with radioactive decay counts or gravitational acceleration tests to see if results are consistent.
2. Biological Studies: Plant Height & Animal Weights
Scientists measure the height of many plants in a forest across different soil types. They also weigh newborn mice or monitor heart rates in fish. Standard deviation tells them how much variation exists around the average. A small deviation means traits are similar; a large one means more diversity. It helps in understanding genetics, ecology, or health. It’s used in leaf size studies and bacterial growth rates too.
3. Chemistry Labs: Reaction Yield & pH Consistency
During experiments, chemists repeat a reaction multiple times to measure yield. They also record pH values during titrations or use spectrophotometers for concentration readings. Standard deviation tells how reproducible those results are. It reveals if their technique or instruments are stable. It’s also used to compare catalyst efficacy and gas volume measurements.
Finance & Economics
4. Stock Market Volatility: Daily Price Swings
Financial analysts calculate day-to-day returns for stocks like Apple or Tesla, ETF changes, and Bitcoin price movement. Standard deviation quantifies how wild or calm those price swings are. A high deviation means higher risk; a low one means stability. This statistic helps investors assess whether they can handle the ups and downs. It’s also useful for bond yield or crypto volatility comparisons.
5. Economic Indicators: GDP, Inflation & Unemployment
Economists track annual GDP growth, unemployment rates, and inflation across countries. Standard deviation helps them see which nations or periods had stable performance vs. volatile changes. A high standard deviation in inflation could signal economic instability. It’s also used for consumer spending, housing prices, and wage variability.
6. Portfolio Risk: Balancing Investments
Financial advisors analyze returns of mutual funds, pension portfolios, gold, real-estate funds, and commodities across years. Standard deviation shows how much returns fluctuate. It guides how to mix assets so clients get reliable outcomes, not big shocks. A balanced portfolio aims for moderate return with low deviation.
7. Standard Deviation in Standardized Test Scores (e.g., SAT, ACT, GRE, IQ)
Standard deviation helps show how scores on standardized tests like the SAT, ACT, or GRE spread out. Test administrators gather thousands of student scores and calculate the average. Then they calculate the standard deviation to see how far individual scores deviate from that average.
A low standard deviation means most students scored similarly; a high one means scores are more spread out. Colleges use this to set admission benchmarks and compare applicants against national norms. IQ tests use standard deviation (usually ±15) to classify intellectual ranges. Test publishers also check standard deviation in practice tests to ensure consistency.
8. Standard Deviation in Survey Responses (e.g., Polls, Satisfaction Studies)
Social scientists use standard deviation to understand how varied survey responses are. For example, in a customer satisfaction poll scored 1–5, researchers calculate the mean response and the deviation. If most people press “4” or “5,” the standard deviation is low, showing agreement. If scores range from “1” to “5,” the standard deviation is high, indicating disagreement. This helps companies identify products or services that divide opinion. In political polling, analysts use it to gauge polarization across demographics. Psychology researchers also apply it to mental health questionnaire data.
9. Standard Deviation in Classroom Performance (e.g., Exam Scores, Attendance)
Teachers calculate class averages on tests and also measure how scores spread using standard deviation. If most students score close to the mean, the deviation is low, showing uniform understanding.
But wide score variation results in a higher standard deviation, indicating learning gaps. This helps teachers identify topics that need reteaching or additional support. Schools can analyze other metrics, like homework completion rates, GPA, or attendance—through standard deviation too. Doing so helps highlight equity issues, outliers, or inconsistent engagement.
Standard Deviation in Industry & Engineering
10. Standard Deviation in Manufacturing Quality Control
Manufacturers measure components—such as bolt diameter, bottle fill volume, or circuit board resistance—over many batches. They calculate the mean and then the standard deviation of those measurements. A small standard deviation means products are consistent and meet specifications.
A large standard deviation flags variability or production issues. Car engine parts, for example, require tight tolerances; standard deviation tracks dimensional accuracy. Beverage companies use it to monitor fill levels to avoid under- or over-filling. Quality engineers use control charts with standard deviation lines to monitor process stability over time.
11. Standard Deviation in Engineering Test Data
Engineers perform destructive and non-destructive tests on materials like concrete, steel, or electronics. They test multiple samples for tensile strength, vibration frequency, or electrical resistance. Standard deviation helps quantify how much test results differ among samples. This ensures reliability and safety in final products. For instance, engineers testing bridge concrete collect compression strengths and calculate deviation to validate quality. In aerospace design, they test battery discharge cycles or pipe pressure thresholds and look at spread in results. If variability is high, they modify materials or processes to reduce risk.
12. Standard Deviation in Process Optimization
In manufacturing, standard deviation is used to keep production and processing consistent and efficient. For example, engineers monitor cycle time variability—the time it takes to complete one unit. If cycle times vary widely, the process may bottleneck or waste resources. Tracking standard deviation in energy use per unit helps identify inefficiencies, such as machines that consume more power during off-peak hours. In quality control, metrics like defects per million rely on standard deviation to detect whether variations are within acceptable limits (such as Six Sigma’s tight thresholds).
Chemical plants use it to assess yield variability in reactions, ensuring batches are consistent and cuts in raw material waste. Machine downtime data is also analyzed: a lower standard deviation means more predictable, reliable uptime. Organizations following Lean manufacturing regularly review these values to streamline processes, minimize waste, and improve process capability indices like Cp and Cpk.

Healthcare and Medicine
13. Standard Deviation in Clinical Trial Results
In a clinical trial, researchers test new medicines on groups of patients. Let’s say a drug is made to lower blood pressure. If 100 patients take it and their results vary a lot, it means the standard deviation is high. That tells doctors the drug might not work the same for everyone. In another trial, patients might recover from a surgery in 5, 6, or 7 days.
If most people heal in 6 days, with just a small difference, then the standard deviation is low. This makes the recovery process easier to plan. Doctors also use standard deviation to study how cholesterol levels change after giving medication. If results are all over the place, the drug may not be reliable. Tracking side effects or how many people feel better also shows how spread-out the results are.
14. Standard Deviation in Health Metrics (Population/Patient)
Doctors check health readings like blood sugar or temperature. For people with diabetes, blood sugar can change a lot. If one person’s sugar levels are all over the place, the standard deviation is high. A low standard deviation means their sugar levels are steady. The same goes for pulse rate or body temperature.
If someone’s temperature jumps every hour during illness, doctors worry. A low deviation means they’re recovering. When doctors look at BMI in kids or adults, they check how far someone’s number is from average. Lung capacity tests or oxygen readings help track if someone needs help breathing. Standard deviation helps compare these numbers easily.
15. Standard Deviation in Epidemiological Studies
Public health experts study diseases in cities and countries. For example, during COVID-19, some cities had very high infection rates, while others had low. The standard deviation showed how much variation there was. A high standard deviation meant the disease wasn’t spreading evenly.
The same is true with flu outbreaks, if one school has many cases and others have none, that matters. Experts use it for vaccine coverage too. If one area has 90% vaccinated and another has 40%, standard deviation is large. This helps plan where to send more vaccines. It’s also useful in checking death rates or regional illness patterns.
Sports and Performance Analysis
16. Standard Deviation in Athletic Performance Metrics
In sports, athletes often repeat the same tasks, like running laps or shooting hoops. If a sprinter always finishes a 100-meter race in about 10 seconds, with small changes, they’re consistent. That means low standard deviation. But if their times jump from 10 to 12 seconds, it’s high deviation.
Coaches look at this to see who performs well under pressure. In baseball, a player with a batting average that changes a lot each game shows high variability. Golfers with steady scores each round have lower standard deviation. This helps coaches plan who should play when.
17. Standard Deviation in Fitness Tracker Data
Fitness trackers measure things like steps, calories, and sleep. If you sleep 8 hours every night, your sleep data has low standard deviation. But if your sleep changes a lot—from 5 hours to 9 hours—it has high deviation. The same goes for steps per day. If you walk 10,000 steps every day, that’s steady. But if it drops to 2,000 on weekends, the number varies a lot. Fitness apps use this info to tell you if your habits are stable or need improvement. Even heart rate while resting is tracked. If it jumps up and down every day, it could mean stress.
Everyday and Miscellaneous Applications
18. Standard Deviation in Consumer and Market Analysis
Businesses track what people buy, how often, and what they like. If most shoppers visit a store once a week, with a few more or less, it’s a steady pattern. But if some come daily and others monthly, it’s less predictable.
That’s where standard deviation helps. It’s also used in product reviews. If one product has lots of 5-star and 1-star ratings, it has a high deviation. But if most ratings are 4 stars, it’s more stable. Delivery times are another thing. If packages arrive within 2–3 days each time, the business is doing well.
19. Standard Deviation in Personal Finance and Budgeting
In budgeting, people track how much they spend each month. If someone always spends around $500 on groceries, that’s low deviation. But if one month it’s $300 and the next it’s $800, something changed. The same goes for utility bills, like electricity or water. If prices are steady, it’s easier to plan.
High deviation might mean a leak or problem. People also track their income. If your pay changes a lot, it’s harder to save. Standard deviation makes these ups and downs easier to spot.
20. Standard Deviation in Traffic and Transportation
People use standard deviation to study travel times. If your bus always comes at 8:10 a.m., that’s great. But if some days it comes at 8:00 and other days at 8:30, the standard deviation is high. This makes it hard to plan your trip.
The same goes for how long a commute takes. If driving to school always takes 20 minutes, it’s easy to manage. If it changes a lot, you need to leave early. Train delays, traffic speeds, and congestion levels all use standard deviation to see if there’s a traffic problem.
21: Standard deviation shows variability in pendulum swing times for accurate physics experiments.
22: Fluctuations appear in radioactive decay counts during measurement.
23: Spread of particle velocities occurs in physics tests.
24: Variations exist in light intensity in spectroscopy data.
25: Differences in gravitational acceleration happen across locations.
26: Uncertainty appears in quantum state measurements.
27: Variation manifests in plant heights within a forest population.
28: Differences show in fish lengths during ecological studies.
29: Diversity presents in bacterial growth rates under lab conditions.
30: Heart rate variability appears across populations.
31: Differences arise in enzyme activity levels in assays.
32: Reaction yield consistency matters in chemistry labs.
33: Variation exists in pH measurements during titrations.
34: Gas volume measurements differ across chemical reactions.
35: Fluctuations occur in spectrometry absorption values.
36: Daily return volatility affects Tesla stock prices.
37: Price swings occur in the S&P 500 index.
38: Cryptocurrency prices undergo significant changes.
39: Bond yield fluctuations signal investment risks.
40: Yearly GDP growth varies among countries.
41: Inflation rates change across different regions.
42: Consumer spending shifts month to month.
43: Unemployment rates differ regionally.
44: Annual returns vary in mutual funds.
45: Hedge fund performance shows volatility.
46: Real estate market prices display variability.
47: Corporate earnings fluctuate across fiscal periods.
48: SAT math scores spread among test takers.
49: GRE verbal test results show variation.
50: IQ scores distribute differently within populations.
51: Literacy test outcomes differ across groups.
52: Job satisfaction varies in employee surveys.
53: Political poll results reveal diverse opinions.
54: Consumer product ratings show variability.
55: Mental health survey answers differ widely.
56: Classroom exam scores vary significantly.
57: School attendance rates fluctuate over terms.
58: Bolt diameters differ in manufacturing quality control.
59: Bottle fill volumes show consistency challenges.
60: Semiconductor chip sizes vary in fabrication.
61: Tire tread depths differ among production batches.
62: Circuit boards have electrical resistance variability.
63: Bridge vibration varies during load testing.
64: Aircraft component lifespans differ.
65: Concrete strength shows variability in construction.
66: Assembly line cycle times fluctuate.
67: Machine downtime varies greatly.
68: Patient drug response times differ in clinical trials.
69: Blood pressure readings fluctuate among patients.
70: Cholesterol level changes show variability.
71: Vaccine efficacy differs across populations.
72: Blood glucose levels vary in diabetics.
73: BMI changes differ within population studies.
74: Pulse oximetry readings vary in patients.
75: COVID-19 infection rates differ between regions.
76: Hospital admission numbers show variability.
77: 100-meter sprint times vary among athletes.
78: Basketball free throw percentages differ.
79: Golf swing shot distances display variation.
80: Soccer goal-scoring rates vary widely.
81: Marathon finishing times spread among runners.
82: Daily step counts differ on fitness trackers.
83: Resting heart rates fluctuate over time.
84: Calorie burns differ between workouts.
85: Daily temperatures swing in climate data.
86: Annual rainfall varies over years.
87: Wind speeds change within weather patterns.
88: Sea level rise varies over decades.
89: Atmospheric CO₂ concentrations fluctuate.
90: Fish population counts differ in ecosystems.
91: Forest tree growth shows variation.
92: Customer review ratings display diversity.
93: Grocery spending varies month to month.
94: Utility bill amounts differ monthly.
95: Commute durations vary day to day.
96: Public transit arrival delays differ widely.
97: App usage session lengths vary among users.
98: Online shopping frequency differs across customers.
Leave a Reply