Z-Score-Definition, Calculation, Interpretation, and Examples
 written by Azhar Ejaz
A Z-score is also known as a standard score. It is a statistical measurement that describes a value’s relationship to the mean of a group of values. It is measured in terms of standard deviations from the mean.
A Z-score of 0 indicates that the data point’s score is identical to the mean score, while a Z-score of +1.0 indicates a score that is one standard deviation from the mean, and a Z-score of -1.0 indicates a score that is one standard deviation from the mean in the opposite direction.
Z-Score Formula
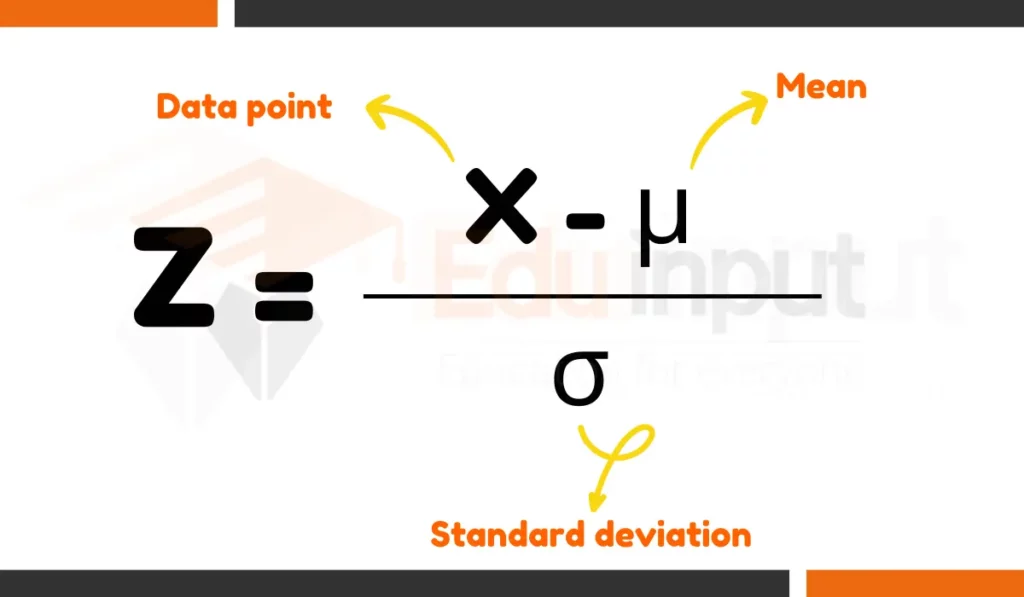
The Z-score formula is given by:
\[ Z = \frac{x – \mu}{\sigma} \]Where:
- ( Z ) is the Z-score (standard score),
- ( x ) is the observed value,
- ( \mu ) is the mean of the sample, and
- ( \sigma ) is the standard deviation of the sample.
How to Calculate Z-Score?
Here are the steps to calculate z score:
Steps
- Identify the data point (x): This is the individual value you want to find the z-score for.
- Identify the mean (μ): This is the average value of the entire data set.
- Identify the standard deviation (σ): This is a measure of how spread out the data is around the mean.
- Plug the values into the formula: z = (x – μ) / σ
- Calculate the z-score: Simplify the expression to get the final z-score.
To calculate a z-score, use formula:
For instance, suppose you scored 75 on a test, the class average is 70, and the standard deviation is 5. The calculation would be:
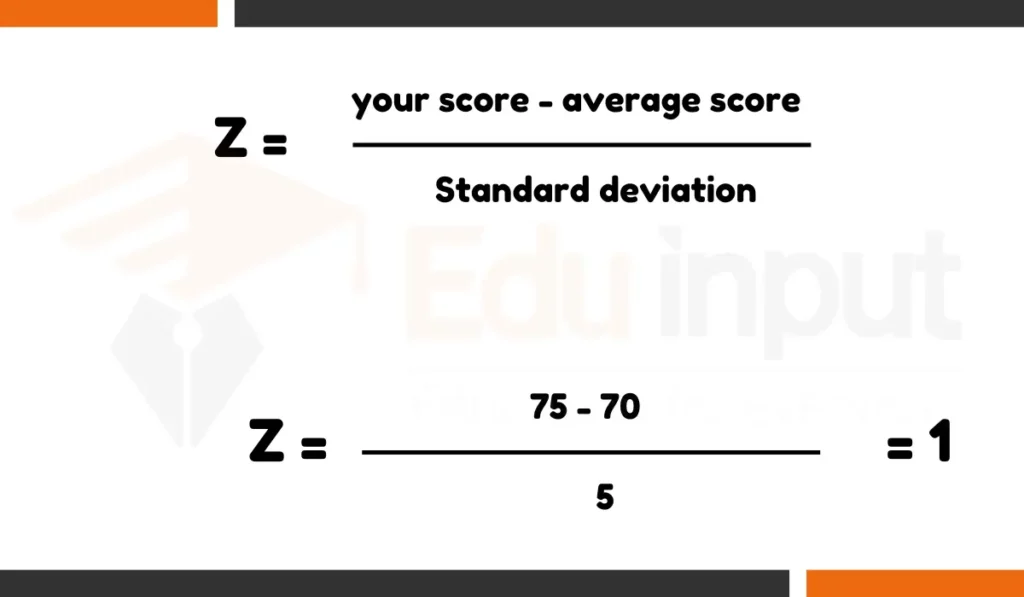
So, your z-score is 1. This means your score is one standard deviation above the average. If the z-score were -1, it would indicate one standard deviation below the average. The z-score helps you understand where your score stands relative to the average and how spread out the scores are.
Z-Score Interpretation
Z-score 0 = mean. Positive z-score = above mean, each unit increase +1 standard deviation. Negative z-score = below mean, each unit decrease -1 standard deviation.
Here is the detailed description to interpret Z-score:
Interpreting value of a z-score:
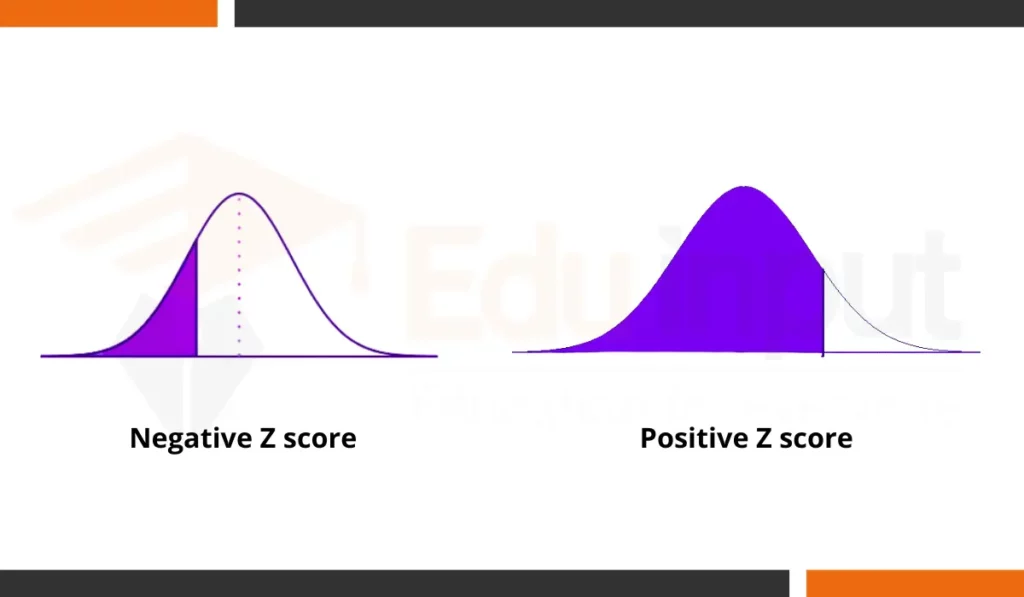
- 0: A z-score of 0 indicates that the data point is exactly at the mean of the distribution.
- Positive: A positive z-score signifies that the data point is above the mean.
- The higher the z-score, the further away from the mean and the more unusual the data point is.
- For example, a z-score of +1 signifies one standard deviation above the mean, while a z-score of +2 signifies two standard deviations above the mean.
- Negative: A negative z-score indicates that the data point is below the mean.
- The lower the z-score, the further away from the mean and the more unusual the data point is.
- For example, a z-score of -1 signifies one standard deviation below the mean, while a z-score of -2 signifies two standard deviations below the mean.
Negative and Positive Z-Score Table are given at the end.
Interpreting z-scores using standard normal distribution
- Area under the curve: The area under the curve of the standard normal distribution represents the probability of a data point falling within a certain range of z-scores.
- Height of the curve: The taller the curve at a particular z-score, the higher the probability of a data point falling within that range.
- Tails of the curve: The tails of the curve represent the less likely z-scores, indicating more unusual data points.
Interpreting z-scores using Standard deviations
- A z-score equal to 1 represents an element, which is 1 standard deviation greater than the mean.
- A z-score equal to 2 signifies 2 standard deviations greater than the mean, etc.
- A z-score equal to -1 represents an element, which is 1 standard deviation less than the mean.
- A z-score equal to -2 signifies 2 standard deviations less than the mean, etc.
Other concepts to Interpret Z-scores
- Less than 0: A z-score of less than 0 represents an element less than the mean.
- Greater than 0: A z-score of greater than 0 represents an element greater than the mean.
- Equal to 0: A z-score of 0 represents an element equal to the mean.
- Large sets: If the number of elements in the set is large, approximately:
- 68% of the elements have a z-score between -1 and 1.
- 95% have a z-score between -2 and 2.
- 99% have a z-score between -3 and 3.
Understand Z-scores with Real-world Examples
Z-scores help us understand how individual data points relate to the overall average and spread of a dataset. They are especially useful when comparing data sets with different units or scales. Here are some real-world examples:
Example 1: Exam Scores
Imagine a student scored 75 points on a math exam with an average score of 70 and a standard deviation of 5. To compare their score with the class performance, we calculate the z-score:
z = (75 - 70) / 5 = 1
A z-score of 1 indicates the student scored 1 standard deviation above the average.
Example 2: Plant Heights
Suppose you measure the height of sunflower plants in your garden. You find their average height is 20 inches with a standard deviation of 2 inches. One sunflower stands out at 24 inches tall. We can calculate its z-score:
z = (24 - 20) / 2 = 2
A z-score of 2 signifies this sunflower is 2 standard deviations taller than the average plant, indicating a potentially significant difference.
Example 3: Stock Prices
Assume you’re analyzing stock market data. The average stock price for a certain company is $100 with a standard deviation of $10. You observe a price of $115 for a specific stock. Calculating the z-score gives:
z = (115 - 100) / 10 = 1.5
A z-score of 1.5 suggests the stock price is 1.5 standard deviations higher than the average, potentially indicating a period of growth or increased interest.
Z-Scores and Their Corresponding Probabilities/Percentiles:
- Z-score 0.05: Approximately 1.645 standard deviations below the mean (84.134% probability)
- Z-score 0.025: Approximately 1.960 standard deviations below the mean (97.5% probability)
- Z-score 0.5: Mean (50% probability)
- Z-score 0: Mean (50% probability)
- Z-score 0.01: Approximately 2.326 standard deviations above the mean (98.764% probability)
- Z-score 0.005: Approximately 2.576 standard deviations above the mean (99.379% probability)
- Z-score 0.95: Approximately 1.645 standard deviations above the mean (84.134% probability)
- Z-score 0.1: Approximately 1.282 standard deviations below the mean (89.442% probability)
- Z-score 0.25: Approximately 0.675 standard deviations below the mean (77.337% probability)
Z-Scores and Percentiles
- Z-score 1: Approximately 84th percentile
- Z-score 1.5: Approximately 93rd percentile
- Z-score 1: 84th percentile
- Z-score 1.28: Approximately 89th percentile
- Z-score 1.96: Approximately 97.5th percentile
- Z-score 1: Approximately 84th percentile
- Z-score 1.25: Approximately 89th percentile
- Z-score -1.28: 10th percentile
- Z-score 1.2: Approximately 88th percentile
- Z-score -1.28: 10th percentile
Negative Z-Score Table
| Z-Score | Probability |
|---|---|
| -3.0 | 0.0013 |
| -2.9 | 0.0019 |
| -2.8 | 0.0026 |
| -2.7 | 0.0035 |
| -2.6 | 0.0047 |
| -2.5 | 0.0062 |
| -2.4 | 0.0082 |
| -2.3 | 0.0107 |
| -2.2 | 0.0139 |
| -2.1 | 0.0179 |
| -2.0 | 0.0228 |
| -1.9 | 0.0287 |
| -1.8 | 0.0359 |
| -1.7 | 0.0446 |
| -1.6 | 0.0548 |
| -1.5 | 0.0668 |
| -1.4 | 0.0808 |
| -1.3 | 0.0968 |
| -1.2 | 0.1151 |
| -1.1 | 0.1357 |
| -1.0 | 0.1587 |
| -0.9 | 0.1841 |
| -0.8 | 0.2119 |
| -0.7 | 0.2420 |
| -0.6 | 0.2743 |
| -0.5 | 0.3085 |
| -0.4 | 0.3446 |
| -0.3 | 0.3821 |
| -0.2 | 0.4207 |
| -0.1 | 0.4602 |
| -0.09 | 0.4681 |
| -0.08 | 0.4761 |
| -0.07 | 0.4840 |
| -0.06 | 0.4920 |
| -0.05 | 0.5000 |
| -0.04 | 0.5080 |
| -0.03 | 0.5160 |
| -0.02 | 0.5240 |
| -0.01 | 0.5320 |
| -0.009 | 0.5331 |
| -0.008 | 0.5341 |
| -0.007 | 0.5351 |
| -0.006 | 0.5361 |
| -0.005 | 0.5371 |
| -0.004 | 0.5381 |
| -0.003 | 0.5391 |
| -0.002 | 0.5401 |
| -0.001 | 0.5411 |
| -0.000 | 0.5413 |
Positive Z-Score Table
| Z-Score | Probability |
|---|---|
| 0.000 | 0.5413 |
| 0.001 | 0.5423 |
| 0.002 | 0.5433 |
| 0.003 | 0.5443 |
| 0.004 | 0.5453 |
| 0.005 | 0.5463 |
| 0.006 | 0.5473 |
| 0.007 | 0.5483 |
| 0.008 | 0.5493 |
| 0.009 | 0.5503 |
| 0.01 | 0.5513 |
| 0.02 | 0.5591 |
| 0.03 | 0.5669 |
| 0.04 | 0.5747 |
| 0.05 | 0.5826 |
| 0.06 | 0.5904 |
| 0.07 | 0.5982 |
| 0.08 | 0.6061 |
Leave a Reply