10 Examples of Venn Diagrams in Math
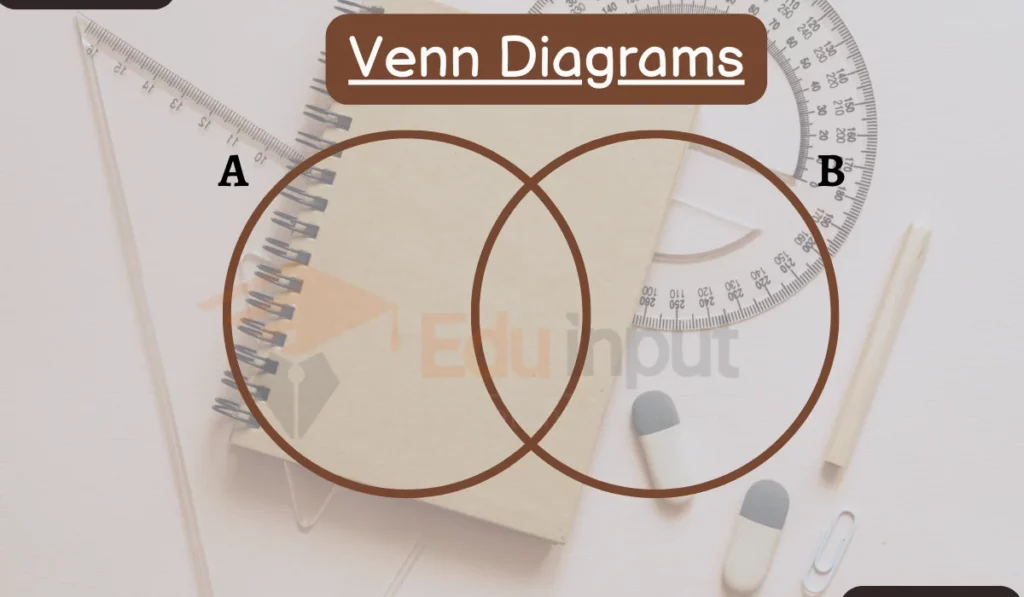
In mathematics, a Venn diagram uses overlapping circles or other shapes to understand the relationships between different sets of items.
In this article, we will discuss ten examples of Venn diagrams are used in math.

Examples of Venn Diagrams
1: Set Intersection
Important use of Venn diagrams is to illustrate the intersection of two sets.
For example, consider two sets: A = {1, 2, 3} and B = {3, 4, 5}. The Venn diagram would show the overlap between A and B, which is the set {3}.
2: Set Union
Venn diagrams are also use in the union of two sets.
Using the same sets A and B as before, the entire area within the circles would represent the union, which is {1, 2, 3, 4, 5}.
3: Set Complement
In a Venn diagram, the complement of a set represents the elements outside of the set.
For example, if A is the set of even numbers, its complement in the universal set of integers would show all the odd numbers.
4: Set Differences
Venn diagrams are illustrate the difference between two sets.
If A is the set of prime numbers less than 10, and B is the set of even numbers less than 10, the difference A – B is {2, 3, 5, 7}.
5: Probability
Venn diagrams are used to visualize probability. In a probability Venn diagram, the total area represents 1 (certainty), and the overlapping regions represent the probability of two or more events occurring.
6: Syllogisms
In logic and philosophy, Venn diagrams can represent syllogisms to determine the validity of arguments.
For example, if “All humans are mortal” and “Socrates is a human,” the Venn diagram would show that “Socrates is mortal.”
7: Number Systems
Venn diagrams are used in the relationships between different number systems, such as natural numbers, integers, and real numbers.
8: Logic Gates
In computer science, Venn diagrams are represent logic gates, showing how binary inputs result in binary outputs, helping in digital circuit design.
9: Sets of Equations
Venn diagrams are used in the solution sets of equations.
For example, the solution to a system of equations with two variables would be represented in the overlapping area.
10: Classifications
Venn diagrams are used in biology, taxonomy, and classification to show how various species share characteristics or belong to different categories.


Leave a Reply